|
The net optical density in the visible spectral range was measured as a function of electron dosage using HEBS-glass plates having been exposed in a number of 3mm × 3mm square areas with the following e-beam pattern generators:
- MEBES of ETEC Systems, Inc.,
- Cambridge EBMF 10.5 e-beam writer.
Results of exemplary exposure schemes are discussed immediately below
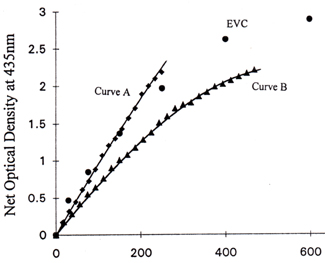
Fig. 7(a) exhibits net optical density values at 435nm vs electron dosage at 30 kv. The e-beam exposure was done using the vector scan e-beam writer, Cambridge EBMF 10.5 The e-beam parameters are as follows:
Curve A - 30 kv, 250na beam current, 0.4µm addressing grid spacing.
Curve B - 30 kv, 75na beam current, 0.2µm addressing grid spacing.
The data points of the net optical density values at 435nm resulting from EVC flood gun exposure at 30kv are shown in the figure for comparison.
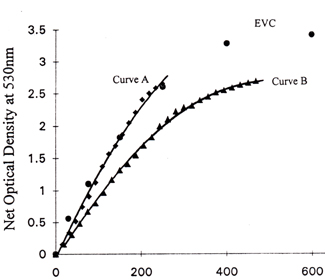
Fig. 7(b) displays the corresponding net optical denisty values at 530nm as a function of electron dosage at 30kv.
Fig. 7(c) exhibits the corresponding net optical density values at 630nm as a function of electron dosage at 30kv.
Electron Dosage (µC/cm2)
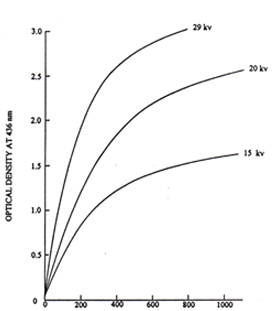
Fig. 6 Optical density at 436nm of HEBS-glass mask versus electron dosage. Electron beam exposure was done with EVC flood exposure system at 29kv, 20kv, and 15 kv.
Previous Page / Next Page
|
Electron Dosage (µC/cm2)
Fig. 7(a) Net optical density at 435nm versus electron dosage at 30 kv
Curve A -- 250na, 0.4µm address size
Curve B -- 75na, 0.2µm address size
EVC-- e-beam flood exposure
Electron Dosage (µC/cm2)
Fig. 7(b) Net optical density at 530nm versus electron dosage at 30kv
Curve A -- 250na, 0.4µm address size
Curve B -- 75na, 0.2µm address size
EVC -- e-beam flood exposure
|