|
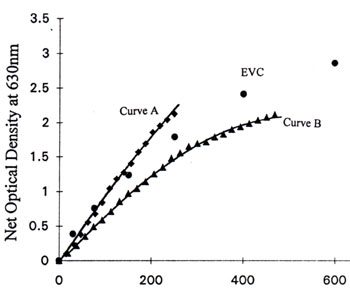
The data points of curve A and curve B in Figures 7 are listed in Table 1 and Table 2 respectively. The e-beam exposure duration in µsec per pixel and the corresponding clock rates to result in the tabulated electron dosage is also listed in the tables.
As is shown in Fig. 7 and the corresponding table, the e-beam induced optical density in HEBS-glass is dependent on e-beam write parameters. This phenomenon can be understood from the mechanism of e-beam darkening which is described in product information number 96-18[2] (Can request this documentation by e-mail).
Fig. 8 exhibits net optical density values at 436nm vs. electron dosage at 20kv. Curve A displays the data of e-beam exposure using the raster scan e-beam pattern generator, MEBES III. MEBES III was operated at 20kv, 40 MHz rate, using a spot size of 1 µm, a beam current of 4000na and an addressing grid size of 0.5µm. These write parameters result in an exposure dosage of 40µC/cm2 per scan count. Electron dosage having multiples of 40µC/cm2 were exposed on HEBS-glass using the number of scan counts as a variable parameter. The data points of Curve A corresponds to 1, 6, 8, 10, 12, and 14 scan counts. Curve B displays the data of e-beam exposure using Cambridge EBMF 10.5 e-beam writer operated at 20kv, 25na and 0.1µm addressing grid spacing. Also shown in Fig. 8 for comparison is the net optical density values at 436nm resulting from EVC flood gun exposure at 20kv.
Electron Dosage (µC/cm2)
Fig. 7(c) Net optical density at 630nm vs. electron dosage at 30kv
Curve A -- 250na, 0.4µm address size
Curve B -- 75na, 0.2µm address size
EVC - e-beam flood exposure
Previous Page / Next Page
|
|
TABLE 1:
|
Net Optical density in HEBS-glass having been exposed to e-beam at 30kv, 250na beam current, 0.4µm addressing grid size using Cambridge EBMF 10.5 e-beam writer at various clock rates.
|
| Exposure duration per pixel (µsec) |
Clock rate (MHz) |
Electron Dosage (µC/cm2) |
Net Optical Density at 435nm |
Net Optical Density at 530nm |
Net Optical Density at 630nm |
| 0.1 |
10 |
15.625 |
0.172 |
0.149 |
0.1 |
| 0.2 |
5 |
31.25 |
0.317 |
0.336 |
0.242 |
| 0.3 |
3.333 |
46.88 |
0.445 |
0.514 |
0.377 |
| 0.4 |
2.5 |
62.5 |
0.613 |
0.744 |
0.553 |
| 0.5 |
2 |
78.125 |
0.729 |
0.909 |
0.681 |
| 0.6 |
1.666 |
93.788 |
0.883 |
1.12 |
0.846 |
| 0.7 |
1.428 |
109.419 |
1.068 |
1.373 |
1.041 |
| 0.8 |
1.25 |
125 |
1.202 |
1.563 |
1.18 |
| 0.9 |
1.111 |
140.639 |
1.297 |
1.689 |
1.273 |
| 1 |
1 |
156.25 |
1.427 |
1.862 |
1.401 |
| 1.1 |
0.909 |
171.892 |
1.574 |
2.045 |
1.566 |
| 1.2 |
0.833 |
187.575 |
1.706 |
2.203 |
1.69 |
| 1.3 |
0.769 |
203.186 |
1.892 |
2.404 |
1.859 |
| 1.4 |
0.714 |
218.838 |
1.998 |
2.505 |
1.955 |
| 1.5 |
0.666 |
234.61 |
2.095 |
2.583 |
2.042 |
| 1.6 |
0.626 |
250 |
2.18 |
2.652 |
2.126 |
|
TABLE 2
|
Net optical density in HEBS-glass having been exposed to e-beam at 30kv, 75na beam current, 0.2µm addressing grid size using Cambridge EBMF 10.5 e-beam writer at various clock rates.
|
| Exposure duration per pixel (µsec) |
Clock rate (MHz) |
Electron Dosage (µC/cm2) |
Net Optical Density at 435nm |
Net Optical Density at 530nm |
Net Optical Density at 630nm |
| 0.1 |
10 |
18.75 |
0.178 |
0.156 |
0.11 |
| 0.2 |
5 |
37.5 |
0.286 |
0.303 |
0.222 |
| 0.3 |
3.333 |
56.25 |
0.419 |
0.482 |
0.353 |
| 0.4 |
2.5 |
75 |
0.552 |
0.671 |
0.492 |
| 0.5 |
2 |
93.75 |
0.646 |
0.805 |
0.59 |
| 0.6 |
1.666 |
112.565 |
0.765 |
0.97 |
0.716 |
| 0.7 |
1.428 |
131.303 |
0.901 |
1.164 |
0.86 |
| 0.8 |
1.25 |
150 |
1.007 |
1.313 |
0.971 |
| 0.9 |
1.111 |
168.767 |
1.077 |
1.411 |
1.042 |
| 1 |
1 |
187.5 |
1.173 |
1.545 |
1.14 |
| 1.1 |
0.909 |
206.271 |
1.282 |
1.692 |
1.255 |
| 1.2 |
0.833 |
225.09 |
1.379 |
1.822 |
1.352 |
| 1.3 |
0.769 |
243.823 |
1.514 |
1.996 |
1.478 |
| 1.4 |
0.714 |
262.605 |
1.597 |
2.1 |
1.555 |
| 1.5 |
0.666 |
281.531 |
1.703 |
2.22 |
1.651 |
| 1.6 |
0.625 |
300 |
1.753 |
2.283 |
1.695 |
| 1.7 |
0.588 |
318.878 |
1.781 |
2.31 |
1.717 |
| 1.8 |
0.555 |
337.838 |
1.864 |
2.396 |
1.792 |
| 1.9 |
0.526 |
356.464 |
1.92 |
2.451 |
1.834 |
| 2 |
0.5 |
375 |
1.991 |
2.515 |
1.903 |
| 2.1 |
0.476 |
393.908 |
2.023 |
2.547 |
1.942 |
| 2.2 |
0.454 |
412.996 |
2.072 |
2.586 |
1.989 |
| 2.3 |
0.434 |
432.028 |
2.122 |
2.631 |
2.039 |
| 2.4 |
0.416 |
450.725 |
2.166 |
2.661 |
2.08 |
| 2.5 |
0.4 |
468.75 |
2.208 |
2.687 |
2.117 |
|